
Update: Mental Health During a Pandemic
Update: Mental Health During a Pandemic
Is it "lock-downs"? Grief? Fear of illness? Isolation? Job loss? Or just all of it at once?

With vaccinations rapidly underway, I’m hoping my obsession with mental health distress during the COVID-19 pandemic will become obsolete soon. Unfortunately, there’s no escaping the fact that the pandemic has brought with it a gloomy cloud looming over many people’s lives for the last year.

In my last post, I wrote about how some data seems to suggest that trends in mental health appear to follow national trends in COVID-19 case counts more than they follow one’s local case counts (the chart above demonstrates this finding and is dicussed further in my last post). But still, that analysis left a lot of questions unanswered. What is driving our collective distress? Is it social isolation? Job loss? Fear about the virus? Or grief for loved ones lost?
One obvious source of stress for people may be the mass job loss and decreased employment rates. The chart below confirms that mental health distress appears to decrease as state-level employment rates increase. However, this relationship is dwarfed by the relationship between state-wide case counts and mental health distress. That is, for each additional 1,000 employed people per 100,000, we see a decline in local mental distress of about 0.3 units. On the other hand, for each additional 1,000 cases of COVID-19 per 100,000, mental distress increases by about 45 units. (For reference, average mental distress over this period hovers between 30 and 40 units.)

To get a better sense of what drives mental distress, I zoomed in on a few states to see what was going on. In the chart below, I show four of the most headline-breaking states: New York, California, South Dakota, and Texas. In each plot, I show the state level average mental distress level (red, right axis) along with the state level and US level case counts per 100,000 (solid grey and dashed grey, respectively).
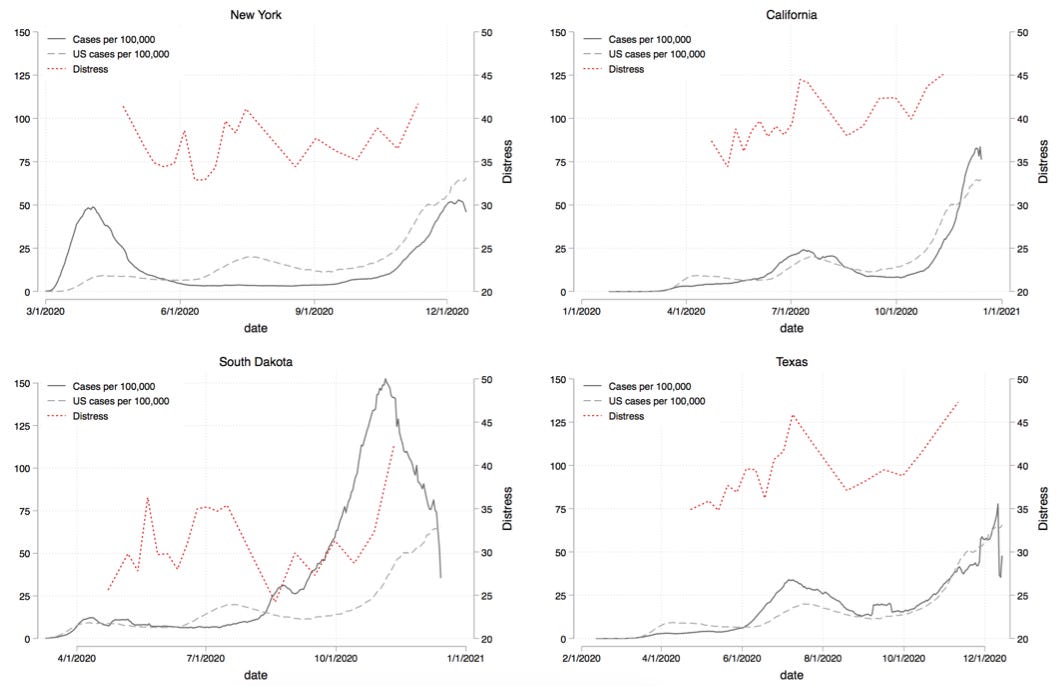
We can see that state-wide mental health levels vary with both the local case counts and the national case counts. This is perhaps most evident when looking at NY where there wasn’t a resurgence of cases in the summer months, but mental health distress did increase along with nation-wide cases.
It’s hard to measure “lock-downs.” What really is a lockdown anyway? In my own uncertainty, I have just cozied up (read: cowered) in my bed this whole time, unwilling to find out what is and isn’t allowed on any given day. To try to see if lock-down measures map to shifts in mental health distress, I added significant dates to the state-level charts. You can see the Texas and North Dakota charts with singificant dates added below.
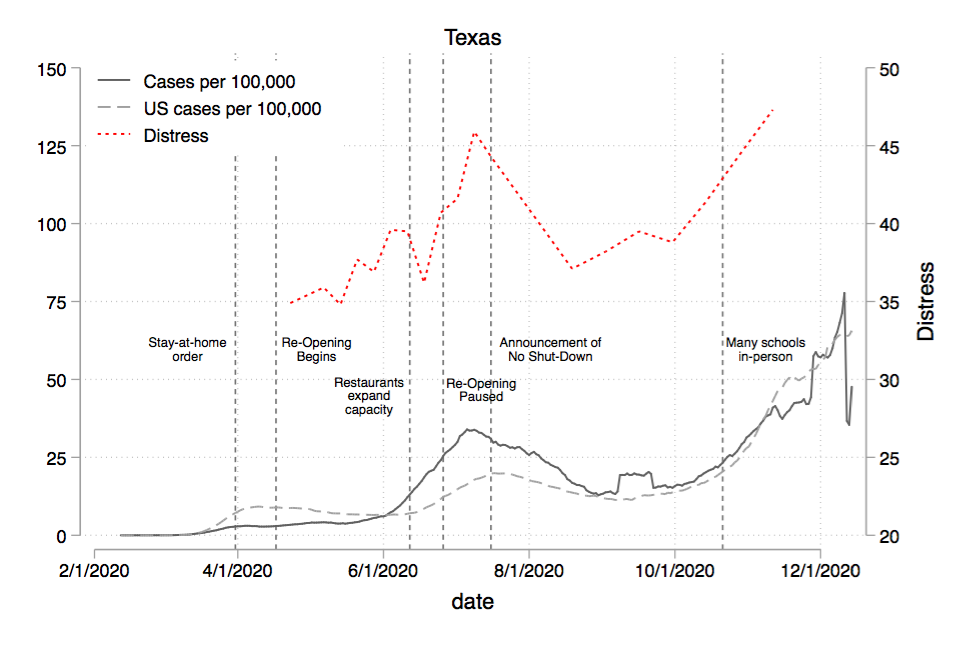
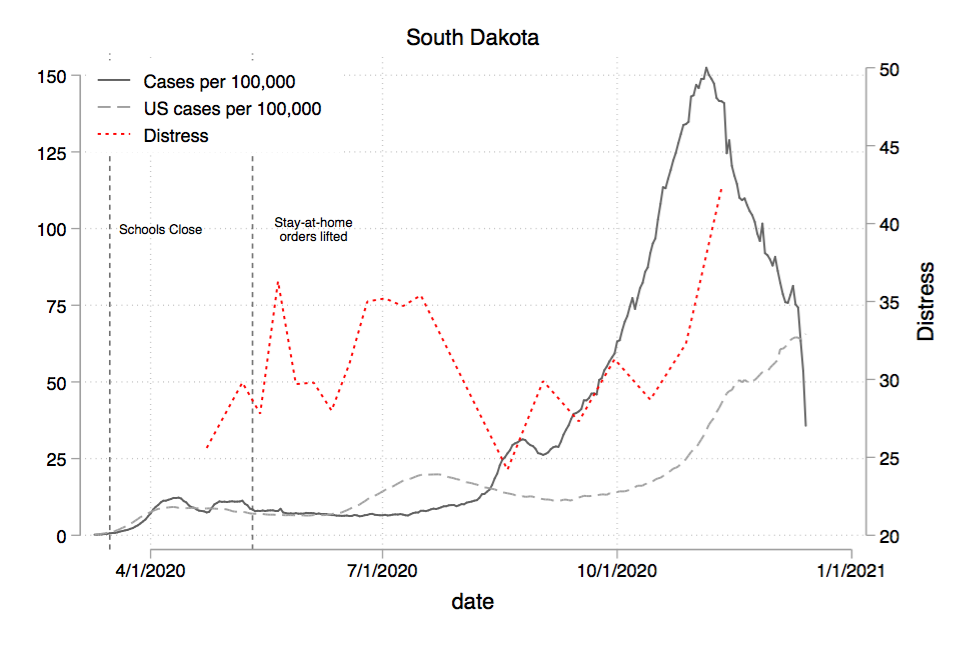
Texas looks like it *might* have had some swings in mood associated with opening/closing announcements (though can’t say with any confidence). On the other hand, South Dakota was practically open the entire time and was not saved from experiencing rising mental distress around periods of high case counts (both during the summer when the country saw increased cases, and in the fall, when SD saw a massive outbreak). So it doesn’t look to me like “lock-downs” were a big driver of mental health distress (though that’s not really the message you’d take away if you were to read headlines in the Washington Post or NY Times).
Of course, things like employment and job loss may be highly related to lock downs and could be big explainers for what’s going on. To see which variables appear most important for predicting mental health distress, I ran a series of regressions testing the relative “explanatory power” of a few possible reasons driving peoples distress: state unemployment, state employment, state case counts, national case counts, and state deaths. My baseline model assumes that all of these factors contribute to mental distress. The question is which factors “matter most.” The measured explanatory power (a technical way of defining what “matters most”) of each factor is charted below. Each bar represents the percentage increase in explanatory power when the respective variable is included in a regression to predict mental health distress relative to a regression that leaves that variable out.

National case counts and state employment-to-population ratio by far outweigh other factors in their explanatory power. That means that people all over the country are probably watching the New York Times case-count tracker and feel a pit in their stomach as they watch cases rise, regardless of where those cases are. Not the most clarifying explanation, but certainly interesting that the national levels matter more than local cases or local deaths. What matters more on a local level is the employment rate (though not the unemployment rate, interestingly). In states that saw large declines in employment, mental distress levels have been higher. (However, if I take out state-level fixed effects, the explanatory power of E-Pop tanks, so maybe state E-Pop is acting as a proxy for something else…).
One way or another, it seems clear that the drivers of mental health distress are largely related to factors having to do with the pandemic “writ large” rather than our accute local experiences. Maybe this is somehow related to “lock-downs” or consequences of lock-downs like disemployment or social isolation. But, not only is “lock-down” a bit ambiguous semantically, it seems like putting the onus on “lock-downs” runs the risk of promoting “opening up” policies that ultimately will result in a prolonged pandemic. And it seems that what people fear most of all is a prolonged pandemic, as measured through the endlessly rising and falling national case levels.
We don’t need to “open up” - prolonging illness, deaths, and joblessness - to be able to remedy people’s despair. Virtual social events, outdoors events, relief aid, public employment over virtual platforms, and (my personal pet policy) a national youth conservation corps that would employ volunteer young people to *safely* contribute to their communities and the environment can all make big contributions to decreasing mental distress while the pandemic goes on.
Data sources:
1) Mental Health Data from the CDC - NCHS: https://www.cdc.gov/nchs/covid19/pulse/mental-health.htm
2) Covid case and death data from the New York Times: https://github.com/nytimes/covid-19-data/blob/master/us-states.csv
3) CPS data downloaded using IPUMS for employment and unemployment data at the state level.